I’d like to introduce you to Voronoi diagrams. Don’t fret, I’m not going to lecture you on the mind-numbing mathematics involved, explain Delaunay triangulation or waffle on about fields of coplanar points or circumcircles. I don’t understand any of that either. But what I do know is that Voronoi diagrams can be used to create some very pretty interactive toys.
Put simply, a Voronoi diagram is a way of illustrating the minimum distance between a set of points. Lines are drawn exactly in the middle between each set of two points, and these subdividing lines group together to make separate regions. Moving the points therefore changes the shape of the regions.
This means it’s easy to create very interesting and beautiful animations only by moving a few dots around! That’s the basic idea, anyway — Wikipedia is your friend if you want to know all the gritty details.
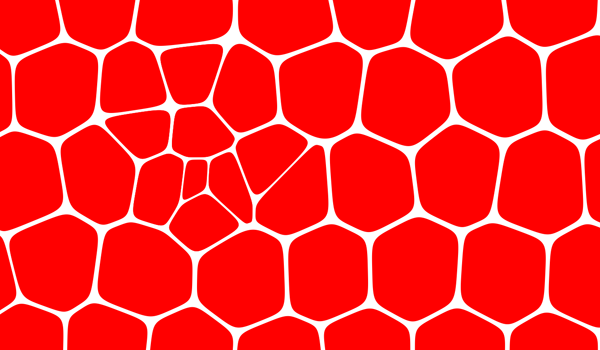
OK, lesson over! Now for some fun. The first Voronoi experiment I’d like to show you uses Paper.js which Val talked about a few days ago. This one shows rounded triangles tessellating together, the mouse being an interactive point, and more points can be added to the diagram with a click. An interactive turtle’s back, if you will.
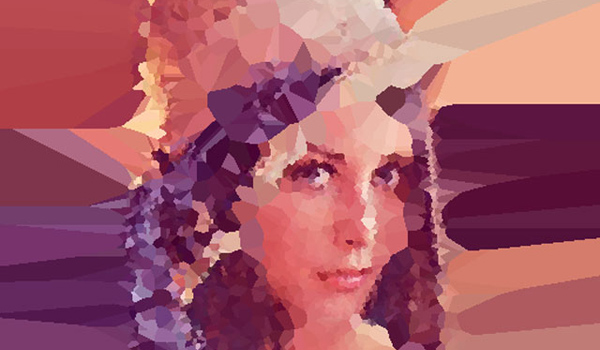
Next comes an experiment from Ralph Hauwert, aka UnitZeroOne. Ralph is better known for his insane 3D Flash work but he has now created this excellent WebGL-based Voronoi app which allows you to draw over an image and create your own modern art.
Play with Jump Flood Voronoi (NOTE: requires a browser with WebGL enabled)
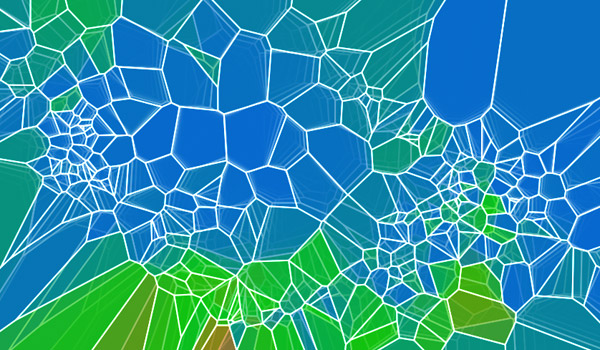
The next one is a very cool Chrome Experiment made by Patrick Lardin. This time the whole diagram is interactive and reacts to the mouse.
And if you still haven’t had enough Voronoi, check out the interactive version on the homepage of my website, which is largely based on Patrick Lardin’s code.


