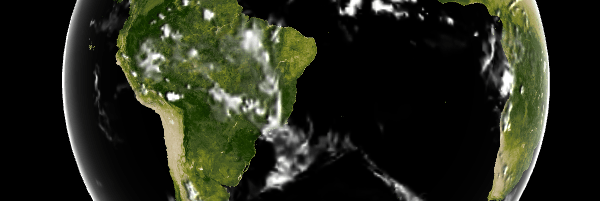
Google’s data arts team has been at it again! This time, with an interactive visualization of cloud data, over a 3d WebGL globe.
The imagery is using data gathered from the weather layer in google maps from 2010 to 2011. There is also the option to underlay the earths vegetation, as well as oceanic currents, which gives a brief glimpse into the relations between cloud and weather formations and the ocean.
The team has cleverly combined all the individual cloud images into a WEBM video, and then wrapped around the globe. The globe itself (which we have seen before) is unsurprisingly rendered via the well known Three.js

