At this year’s Google I/O, Paul Irish demoed Canvas Profiling in Chrome. This feature recently graduated from Canary into Google Chrome so here’s how to enable it.
1. Firstly open Chrome and type chrome://flags into the omnibox. You’ll see a page that looks like this:
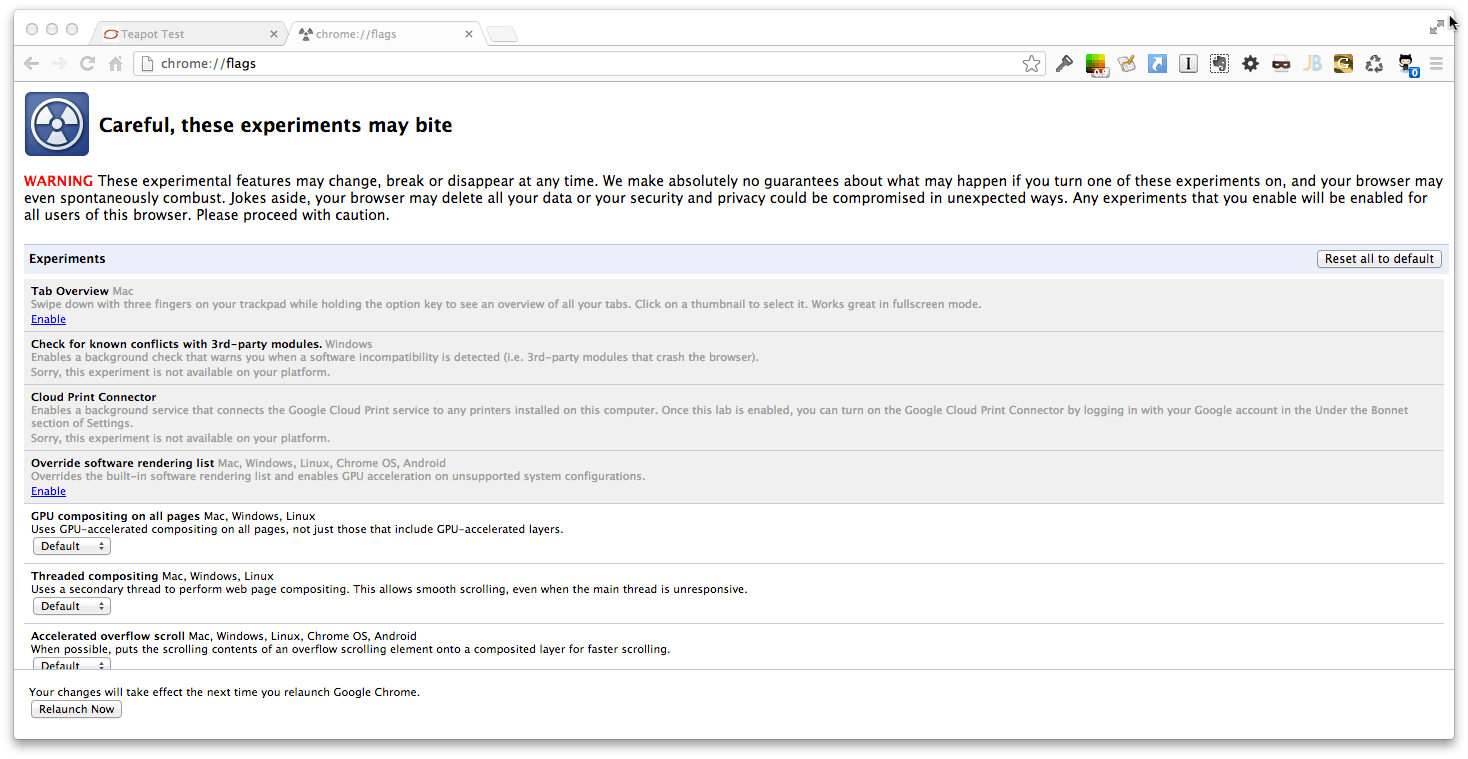
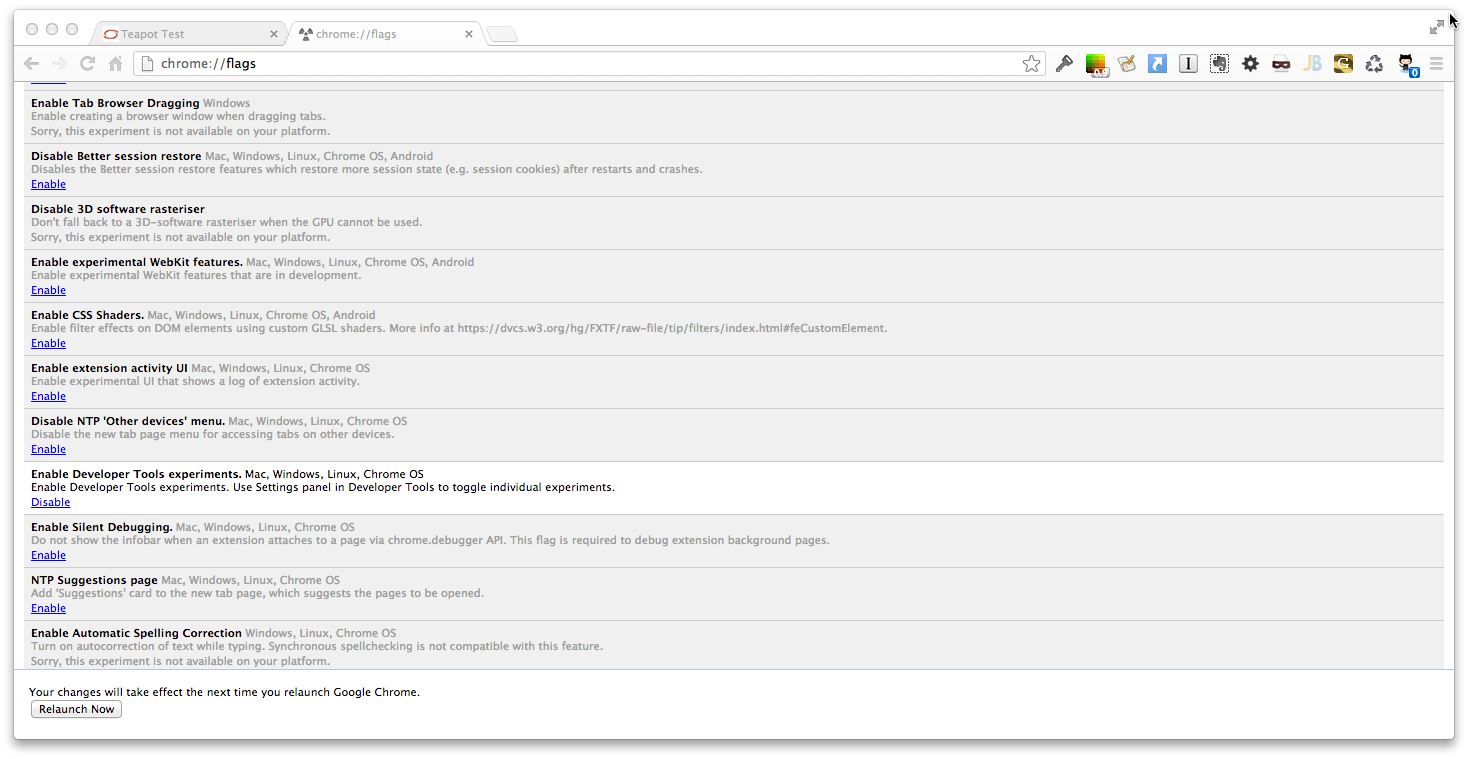
2. Scroll down until you find ‘Enable Developer Tools Experiments’. Check this box then click the button at the bottom of the page to restart Chrome.
3. Next go to any page that has WebGL content and bring up the Dev tools.
4. Click the Settings cog in the bottom right hand corner.
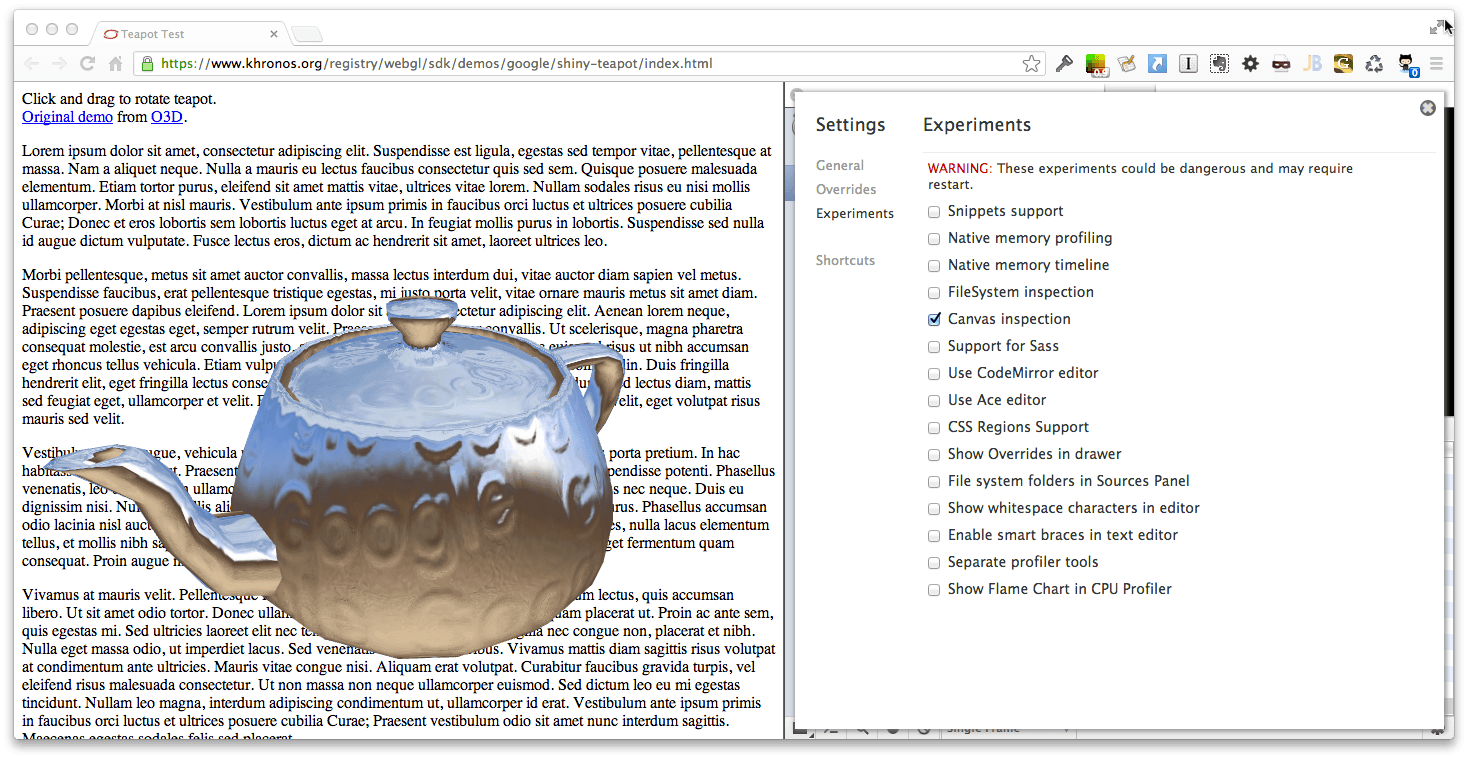
5. Click on Experiments and enable ‘Canvas Inspection’.
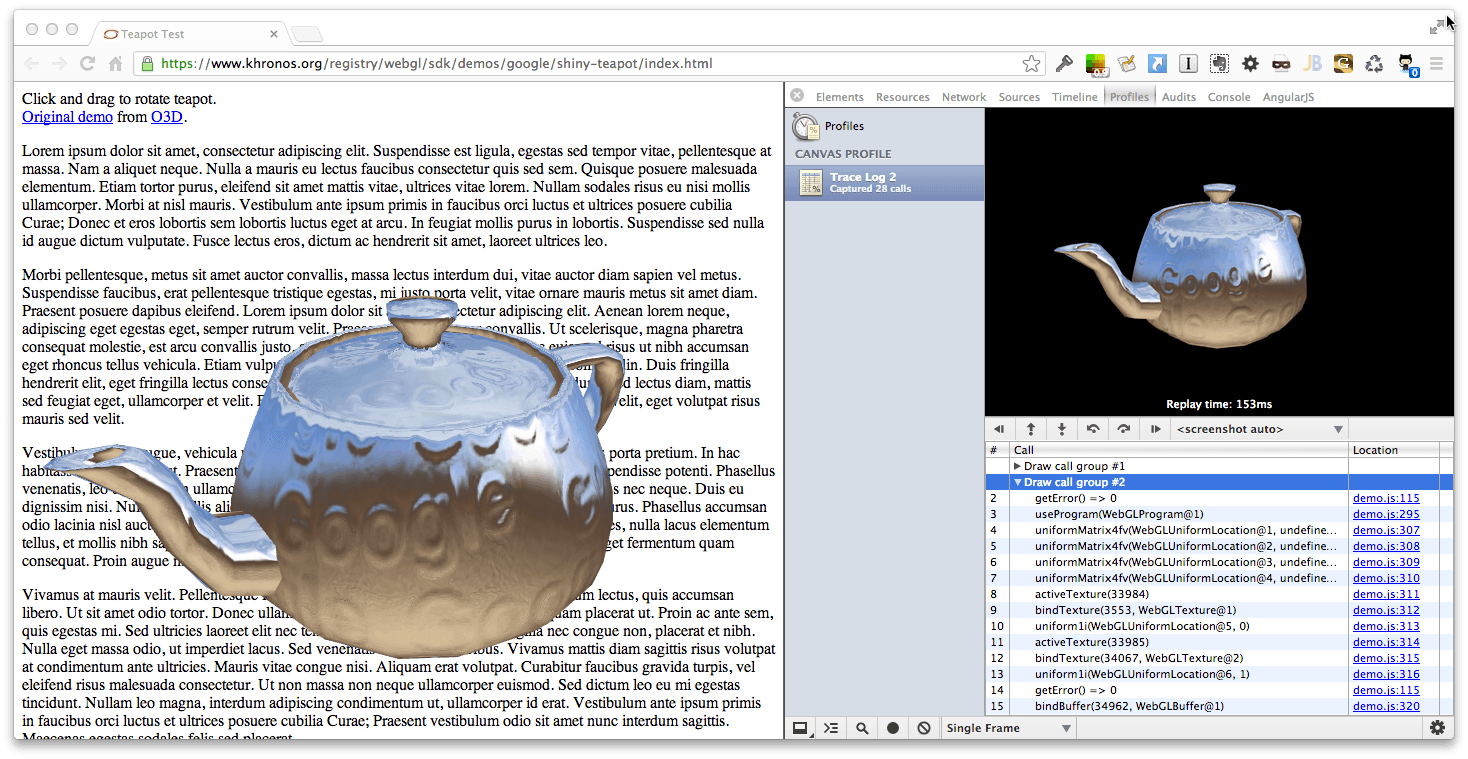
6. Close Settings and click on the Profiles Tab. You should now have a new option: ‘Capture Canvas Frame’. You may need to reload your page to enable it.
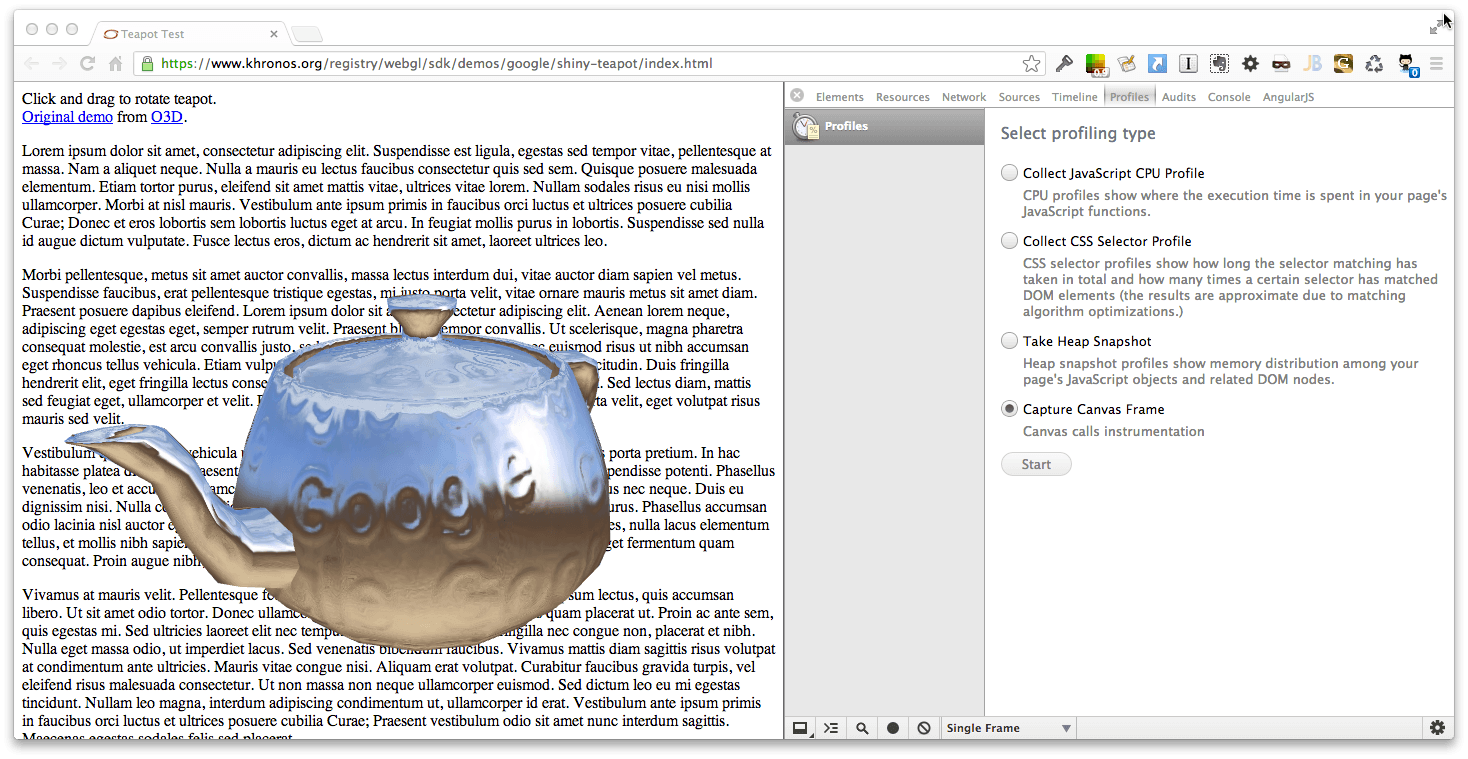
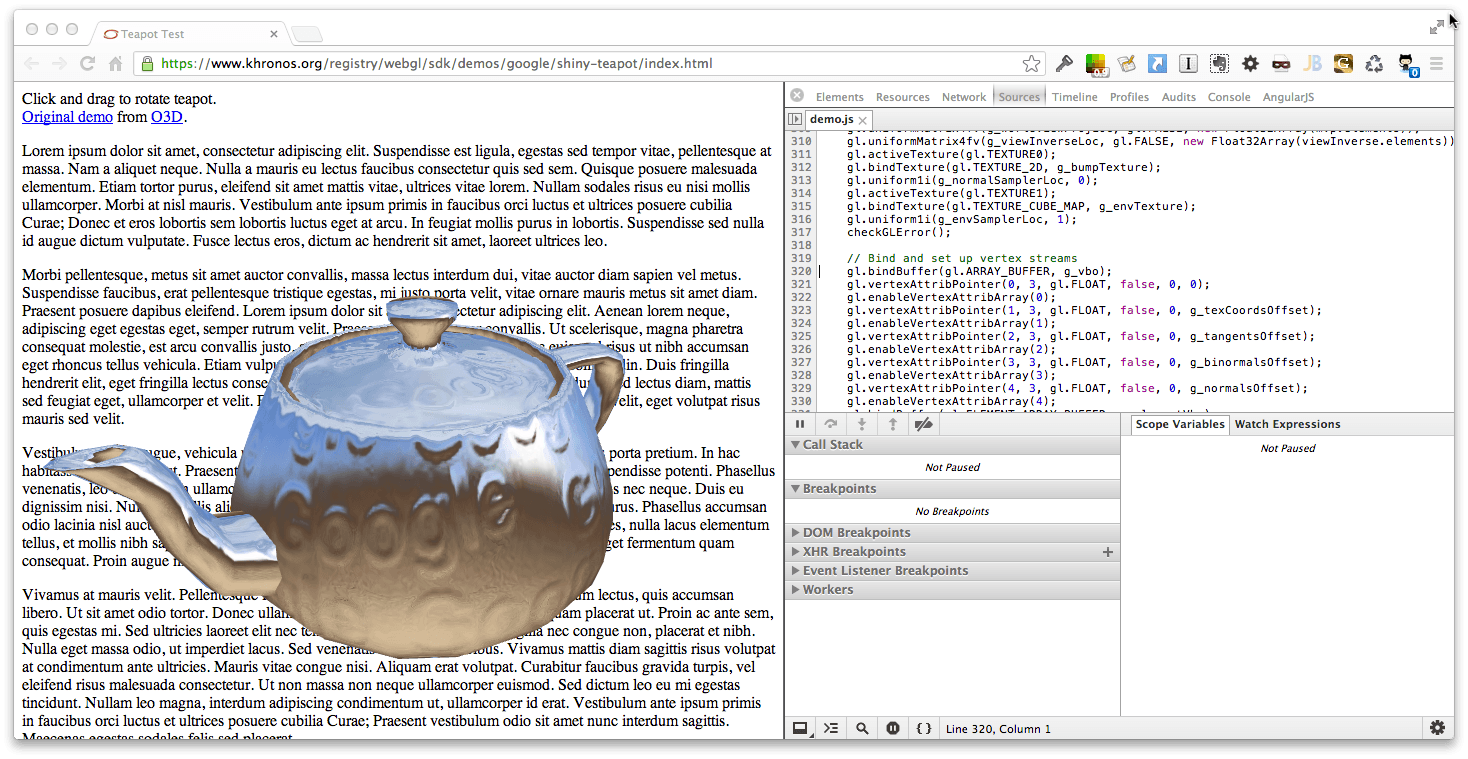
7. Click on it and you’ll see captured Draw Calls appear in the tools window. Turn down the twisty to see the contents of each call. Click through the location links to jump into the source.